Optimizing using gprof and gprof2dot
April 29, 2016
Optimizing computer programs is an important part of the software development process. However, it must be done when it is needed not before. To optimize Bertini2 at this time, I have identified a problem in terms of timing, and a wish to correct it.
The endgames run slow. Tracking seems slow. Initial tests written for the PSEG and CauchyEg ran at the rate of perhaps 30 tests in 3 minutes, and most of these tests involved little or no tracking. The bulk of runtime was in a few calls to solve a few systems with singular endpoints.
Singular endpoints are why the endgames exist. To approach a singularity, you have to do something special. There are several options. Endgames let you not approach the singularity after all. Instead, you compute the cycle number for the path you are on, and use it to estimate the singular root. The Power Series Endgame computes a power series approximation of the path, while the Cauchy Endgame uses Cauchy Integral Theorem with the Trapezoidal rule. Each of the endgames requires tracking between points spaced specially through space near the singularity. So tracking time is intensive here.
About two months ago, I identified points of slowdown in the library code for evaluating the polynomials systems, where I was mistakenly frequently copying shared pointers. This was brutal on performance, so I eliminated the copies.
I also identified the gratuitous production of temporaries as a large consumer of time, perhaps 30 percent of timetime coming from allocating and deallocating multiprecision complex numbers. Certainly this is my fault.
In a quest to eliminate these temporaries, we have several paths. One is to re-implement Straight Line Programs, as done in Bertini1. An ok solution, but I remain unconvinced that they are the best way to go. But they do solve the temporary problem by making persistent temporaries for every point of evaluation. In fact I claim Bertini1''s straight line program is awesome in effect, but not in presentation.
Another path, different from SLP's, is to see if I can just find all those places where temporaries are generated in the current evaluation structure, and attempt to elide them.
A high-power but more difficult option might be to literally compile the system into machine instructions. This would be a step further than the SLP in a way.
For now, I'll see if I can get this tracking time to some factor of speedup slower than Bertini1 less than perhaps 5 or 10, and call it good for now. I always have options later on.
There's a wide world of available software for profiling and analyzing. I'm still learning, so take my advice (if i manage to provide any) with a grain of ancient sea salt.
I have enjoyed the graphs provided by gprof2dot in the past. They're certainly impressive. The tool can generate graphs from other tools than gprof, as well.
Since gprof is installed on the CRC at Notre Dame, and it's really easy to use, it's what I am using at the moment. This is despite cautions regarding accuracy of the generated graphs. I don't need perfect data, just some insight into how horribly I have implemented parts of Bertini2, and a nose to help me make it better. Remember, ultimately I measure in seconds of runtime, so any tool that helps me get there sooner rather than later seems good to me.
Ok, the code is compiled. Today I am working with my commit 572b897, from my develop branch of b2. I compiled with this command, for better or for worse. I am somewhat concerned about the elimination of inlines... But I am still new to this, and the options I use are recommended by gprof2dot, so what the hay. I'm having fun! Plus, I have access to Allinea on the CRC, which I will use in a little while.
./configure LDFLAGS="-L/afs/crc.nd.edu/x86_64_linux/b/bertini/1.5/gcc/4.9.2/boost/1.58.0/lib -L/afs/crc.nd.edu/x86_64_linux/b/bertini/1.5/gcc/4.9.2/mpfr/3.1.3/lib -L/afs/crc.nd.edu/x86_64_linux/b/bertini/1.5/gcc/4.9.2/gmp/6.0.0/lib" --with-boost=/afs/crc.nd.edu/x86_64_linux/b/bertini/1.5/gcc/4.9.2/boost/1.58.0 CPPFLAGS="-fpermissive -I/afs/crc.nd.edu/x86_64_linux/b/bertini/1.5/gcc/4.9.2/boost/1.58.0/include/ -I/afs/crc.nd.edu/x86_64_linux/b/bertini/1.5/gcc/4.9.2/include -I/afs/crc.nd.edu/x86_64_linux/b/bertini/1.5/gcc/4.9.2/mpfr/3.1.3/include/ -I/afs/crc.nd.edu/x86_64_linux/b/bertini/1.5/gcc/4.9.2/gmp/6.0.0/include/ -I$HOME/Private/code/" --with-boost-libdir=/afs/crc.nd.edu/x86_64_linux/b/bertini/1.5/gcc/4.9.2/boost/1.58.0/lib --with-eigen=$HOME/Private/code/eigen3 CXXFLAGS="-pg -g -O2 -DNDEBUG -fno-omit-frame-pointer -fno-inline-functions -fno-inline-functions-called-once -fno-optimize-sibling-calls"
No, I don't type that in every time I configure.
Since I compiled with -pg, the gmon.out file is generated. Feed it into gprof, and capture the text for feeding into gprof2dot. Yay!
Run gprof2dot on the resulting file. Brew install gprof if you're cool.
Since I compiled with -pg, the gmon.out file is generated. Feed it into gprof, and capture the text for feeding into gprof2dot. Yay!
Run gprof2dot on the resulting file. Brew install gprof if you're cool.
So I ran with --strip and --wrap, and the blocks are insanely long due to my insanely long test names. Clearly these names need to be shortened as we groom the test suite in the future. Here's what it looks like (6MB image). Or, here's the same data, in eps, and without wrap and strip. It's almost unusable!
Let's make it a bit better, by inspecting the root of the 16% runtime associated to shared pointers. Looks like it's coming from a variety of places.
Let's make it a bit better, by inspecting the root of the 16% runtime associated to shared pointers. Looks like it's coming from a variety of places.
gprof2dot --wrap -s --leaf="std::_Sp_counted_base<(__gnu_cxx::_Lock_policy)2>::_M_release()" gprof_data_endgame_profile_mptracker.txt --skew=1. | dot -Teps -o endgame_suite_timing_sharedptr_calls.eps

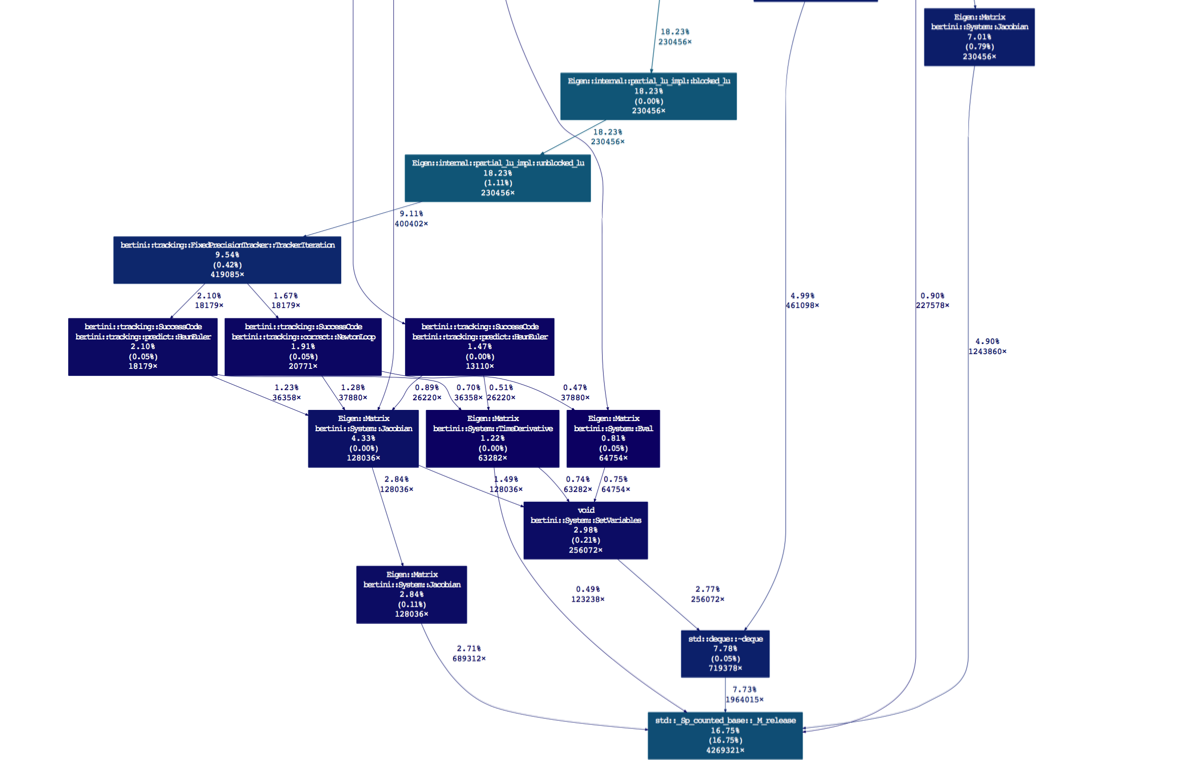
So I definitely need to revisit this SetVariables call. It's causing a repeated creation and deletion of a VariableGroup = std::deque>. The further in this project I get, the more I want a node manager, to help eliminate the shared pointers... That's for another day!
For now, let's content our selves. I have identified a problematic bit of code, now I just need to fix it! I like it when that happens. Thanks gprof2dot, and the entire open source community for being so fabulous and open.
More optimization to come.
For now, let's content our selves. I have identified a problematic bit of code, now I just need to fix it! I like it when that happens. Thanks gprof2dot, and the entire open source community for being so fabulous and open.
More optimization to come.
Here's some cachegrind data on the AMP cauchy endgame.
valgrind --tool=cachegrind -- .libs/endgames_test --run_test=amp_powerseries_endgame_generic_tests_ambient_precision_30
==13924== Cachegrind, a cache and branch-prediction profiler
==13924== Copyright (C) 2002-2012, and GNU GPL'd, by Nicholas Nethercote et al.
==13924== Using Valgrind-3.8.1 and LibVEX; rerun with -h for copyright info
==13924== Command: .libs/endgames_test --run_test=amp_powerseries_endgame_generic_tests_ambient_precision_30
==13924==
--13924-- warning: L3 cache found, using its data for the L2 simulation.
--13924-- warning: pretending that LL cache has associativity 192 instead of actual 128
Running 12 test cases...
*** No errors detected
==13924==
==13924== I refs: 15,540,883,541
==13924== I1 misses: 47,791,993
==13924== LLi misses: 13,605
==13924== I1 miss rate: 0.30%
==13924== LLi miss rate: 0.00%
==13924==
==13924== D refs: 7,005,571,800 (4,613,312,902 rd + 2,392,258,898 wr)
==13924== D1 misses: 55,368,694 ( 46,862,950 rd + 8,505,744 wr)
==13924== LLd misses: 122,309 ( 63,518 rd + 58,791 wr)
==13924== D1 miss rate: 0.7% ( 1.0% + 0.3% )
==13924== LLd miss rate: 0.0% ( 0.0% + 0.0% )
==13924==
==13924== LL refs: 103,160,687 ( 94,654,943 rd + 8,505,744 wr)
==13924== LL misses: 135,914 ( 77,123 rd + 58,791 wr)
==13924== LL miss rate: 0.0% ( 0.0% + 0.0% )
Profiling time alarm